


### Current Trends in Major Cryptocurrencies
The cryptocurrency landscape has seen notable fluctuations this week, with Bitcoin (BTC), Ethereum (ETH), and Ripple (XRP) all facing bearish pressure. As of Friday, Bitcoin’s price hovers around $109,600, reflecting a decline of nearly 5% over the week. Ethereum’s price has settled near its 100-day Exponential Moving Average (EMA), while XRP approaches a critical support level at $2.72. The performance of these major cryptocurrencies signals the potential for deeper corrections if they fail to hold their respective support levels.
### Bitcoin Bears Eye $107,000 Mark
Bitcoin’s journey this week has been tumultuous. The cryptocurrency failed to maintain support at $116,000, witnessing a swift decline of 3.19% over four days. On Monday, it closed below the 50-day EMA at $113,490, further solidifying bearish sentiment. Although a minor recovery was observed on Wednesday, it ultimately fell again, closing down 3.81% below the ascending trendline.
As of now, Bitcoin trades at approximately $109,600, but the outlook remains precarious. If BTC continues its slide, it may extend losses to the next significant support at $107,245.
With a Relative Strength Index (RSI) reading of 38, Bitcoin sits below the neutral level of 50, indicating a prevailing bearish momentum. The Moving Average Convergence Divergence (MACD) recently exhibited a bearish crossover, providing a sell signal that continues to affect price actions. Additionally, the rising red histogram bars below the neutral level suggest ongoing downward pressure.
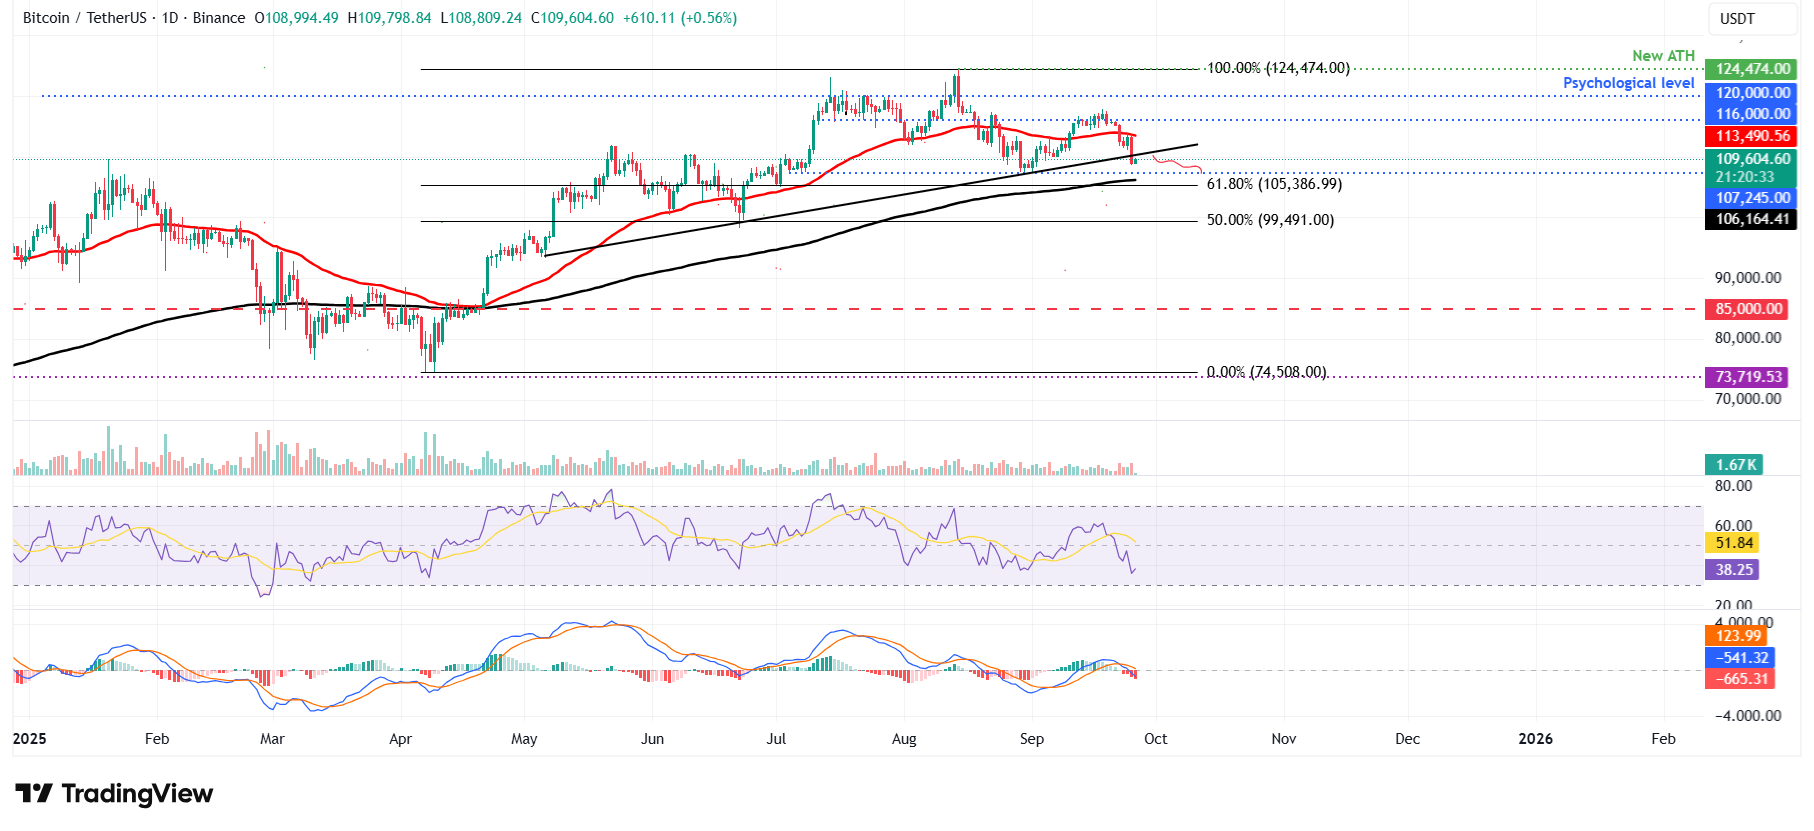
*BTC/USDT daily chart*
However, if Bitcoin manages to recover, it could seek to rally towards the 50-day EMA at $113,490.
### Ethereum May Extend Its Downtrend If the 100-day EMA is Taken
Ethereum has similarly faced a rough week, notably closing below the daily support at $4,488 on September 19 and dropping by nearly 7% over the ensuing days. The price further deteriorated, pushing below $3,900. At present, ETH is attempting to find a foothold around the 100-day EMA at approximately $3,848.
A closing price beneath the 100-day EMA could send Ethereum toward a concerning support level at $3,593. The current RSI stands at 35, having bounced off the oversold level of 30 earlier in the week, indicating a reduction in bearish momentum. However, like Bitcoin, Ethereum’s MACD signals remain predominantly bearish, hinting at the continuation of downward trends.
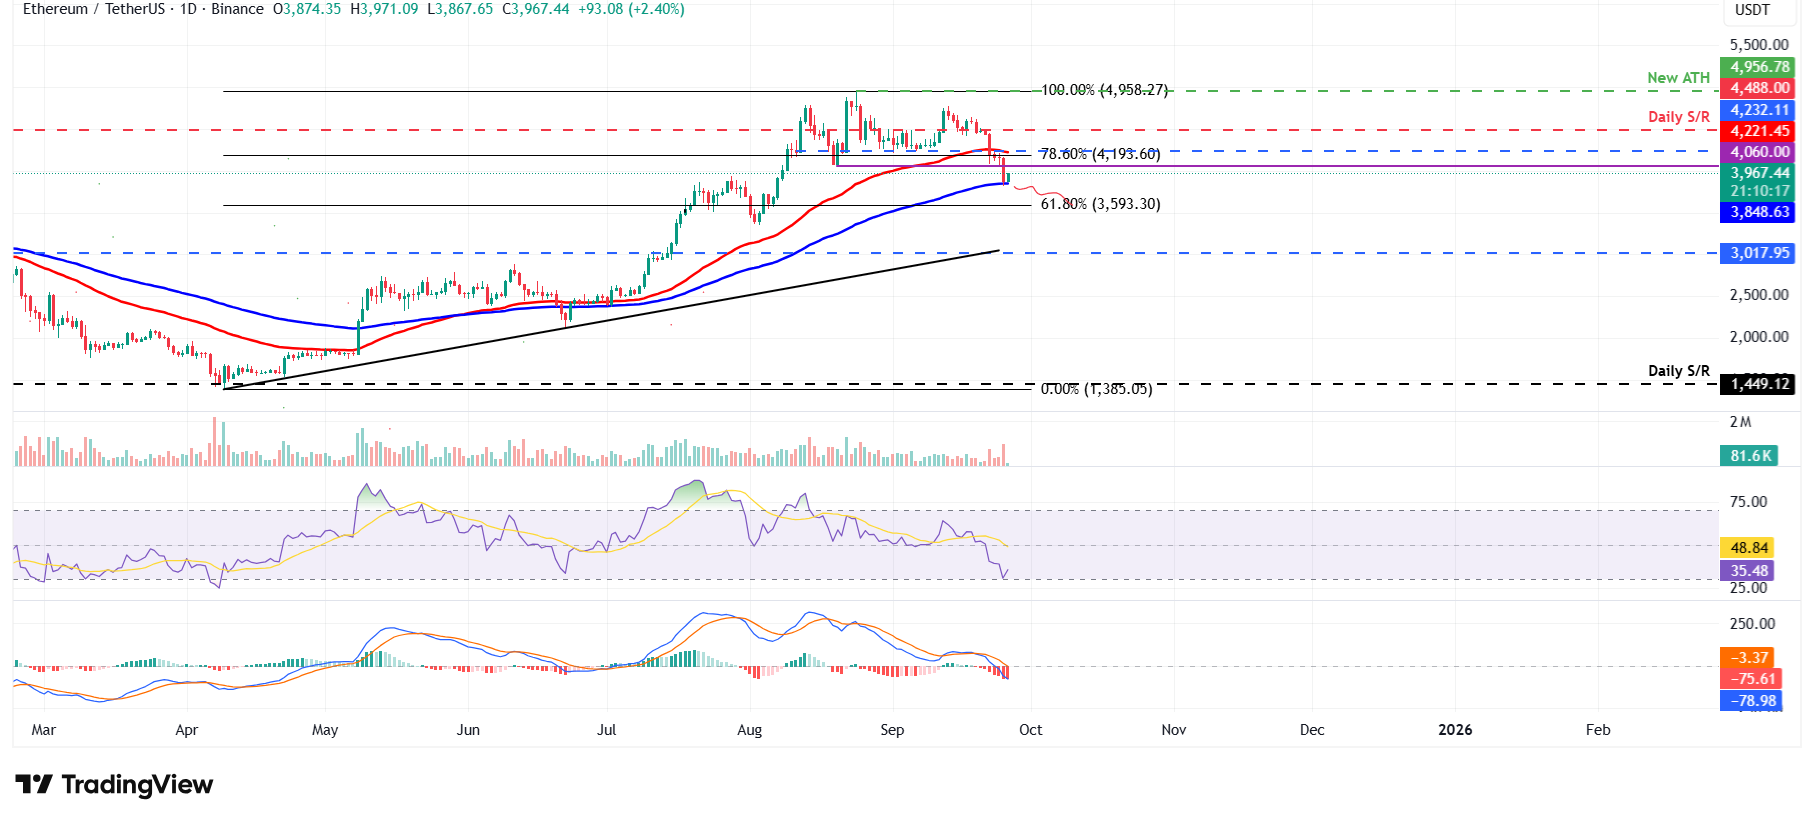
*ETH/USDT daily chart*
Should Ethereum manage to regain ground, it could potentially rise toward the resistance at $4,232.
### XRP Bears Are in Control of the Momentum
Ripple’s XRP has also come under significant scrutiny, struggling to maintain support around the Fibonacci retracement level at $2.99. Following a decline of 6.23% following this failure, XRP currently trades at approximately $2.75.
If XRP continues its downward trajectory and closes below the pivotal support at $2.72, it stands to challenge deeper support at $2.35. The momentum indicators for XRP echo bear sentiments, suggesting that a more substantial correction could lie ahead.
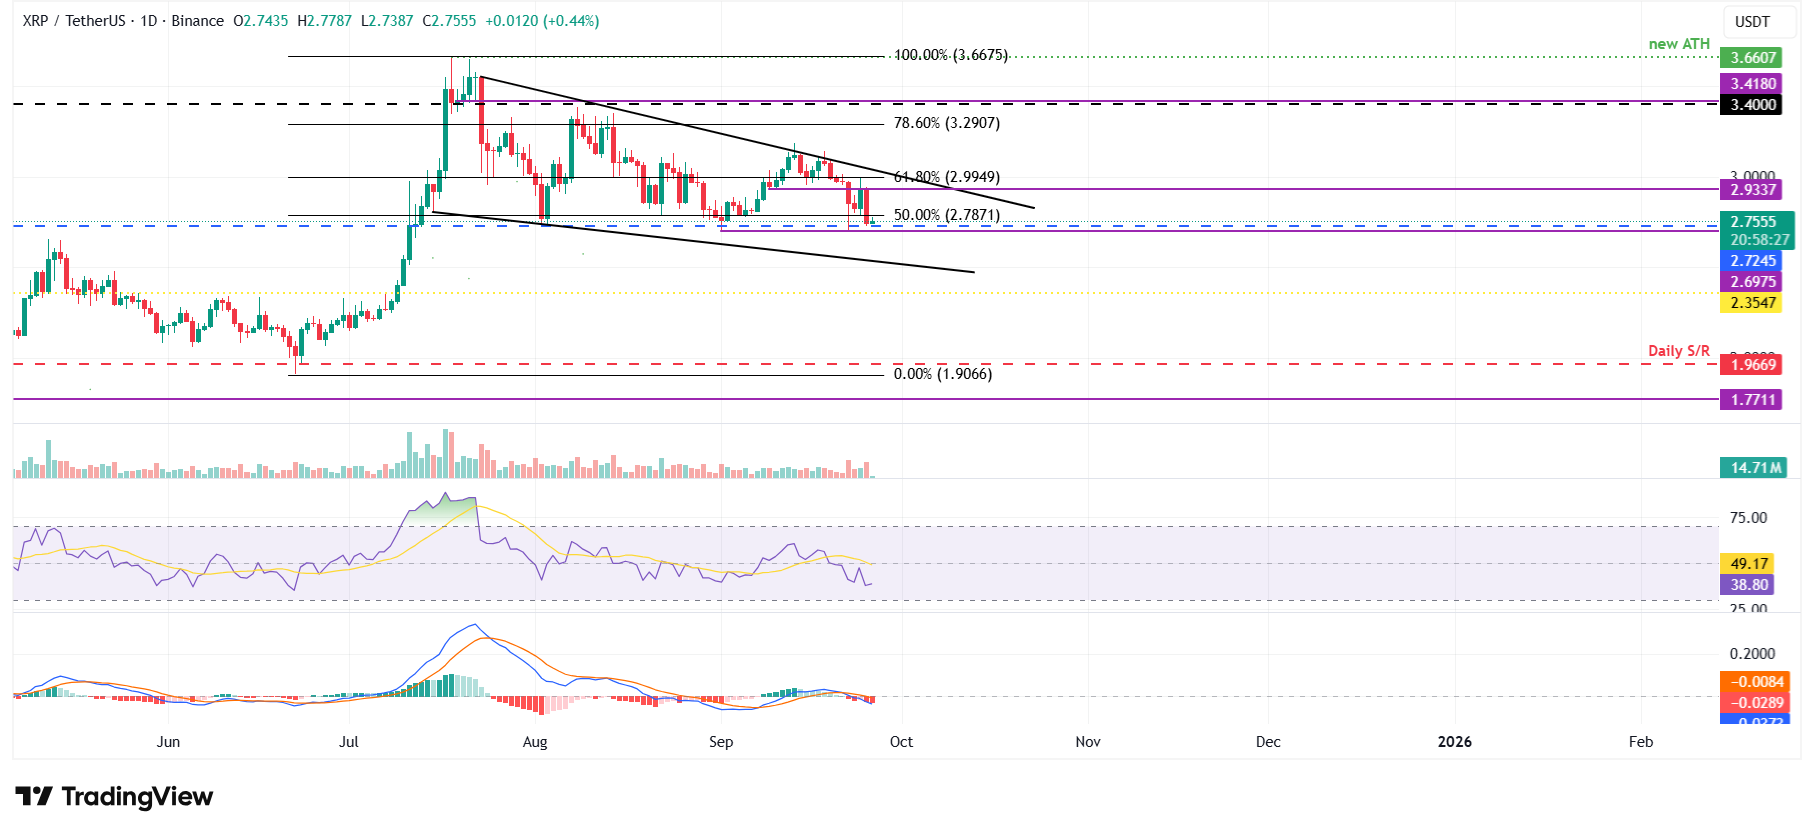
*XRP/USDT daily chart*
Conversely, should XRP find a way to recover, it could chase a rebound toward resistance at $2.99.
### Cryptocurrency Metrics FAQs
In the ever-evolving world of cryptocurrency, understanding key metrics is vital for navigating market dynamics. Whether you’re an investor or simply interested in trends, staying informed about support levels, resistance, and momentum indicators can make a significant difference.
—
This overview captures the current states of Bitcoin, Ethereum, and Ripple, emphasizing the importance of support levels and market indicators in forecasting potential movements. As the week closes, investors and analysts alike are closely monitoring these cryptocurrencies for signs of recovery or further decline.
