


Ethereum’s derivatives market is currently undergoing a significant and potentially transformative shift. Recent on-chain data reveals a change in trader behavior on major exchanges, with a notable trend towards accumulation. Despite Ethereum’s price hovering below the psychologically significant $3,000 threshold, signals indicate that market participants are gearing up for a bullish move, possibly testing this crucial price level in the near future.
Market Dynamics: A Shift to Accumulation
The accumulation phase in cryptocurrency markets often serves as a precursor to upward price movements. With on-chain metrics suggesting increased buying activity, it’s evident that traders are positioning themselves with a positive outlook. As Ethereum continues to flirt with the $2,900 mark, there is growing anticipation that a rally above $3,000 could soon occur. This sentiment is underscored by various indicators reflecting trader behavior on exchanges.
Ethereum Leverage Ratio Hits New Records
Data from the on-chain analytics platform CryptoQuant reveals that Ethereum’s Estimated Leverage Ratio on Binance has soared to an all-time high of 0.611. This metric assesses open interest against exchange reserves, providing insight into the extent of borrowed capital traders are employing relative to available liquidity. The surge in this ratio indicates heightened risk appetite among investors, as they embrace larger leveraged positions in anticipation of favorable price movements.
Such elevated leverage can amplify price reactions, meaning small shifts in Ethereum’s spot price could trigger significant liquidations. The environment created by increasing leverage often correlates with heightened volatility as traders react swiftly to market movements. As we witness this burgeoning appetite for risk, the potential for rapid price moves becomes more pronounced.
Demand Surge: The Taker Buy Sell Ratio
In tandem with rising leverage, another key metric, the Taker Buy Sell Ratio, has surged to 1.13 on Binance. This indicates a stronger preference for buy orders over sell orders, a trend last seen in September 2023. Such an uptick points to robust demand for Ethereum, reinforcing the notion that traders are increasingly optimistic. Historically, spikes in this ratio have been linked to periods of heightened volatility, further signaling a burgeoning bullish sentiment among market participants.
Technical Analysis: Path to the $3,000 Mark
Crypto analyst Ted Pillows has meticulously mapped out Ethereum’s potential trajectory using technical analysis. His observations indicate that ETH recently interacted with a critical demand zone between $2,700 and $2,800. Following a dip below the $3,000 level, where Ethereum reached a low of $2,781, this demand zone is now serving as a rebound point.
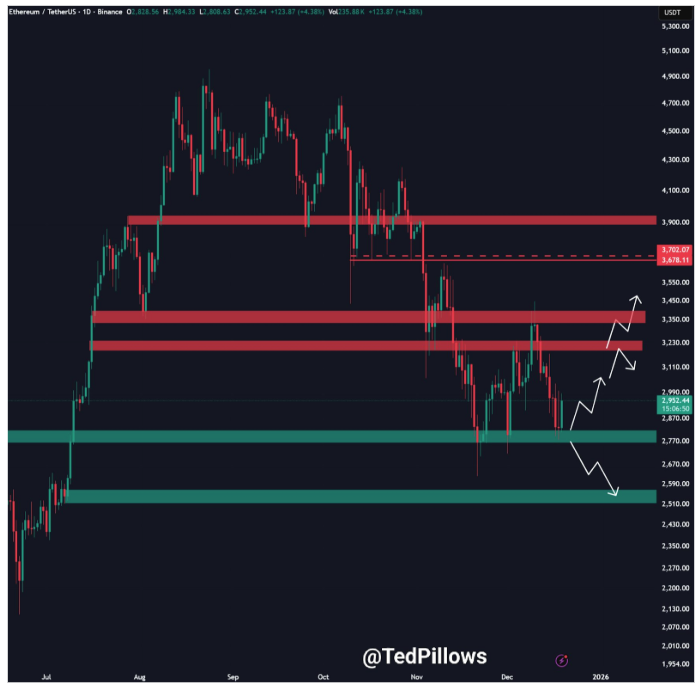
Pillows highlights that maintaining this support level is crucial for a bullish outlook. If buyers can sustain momentum above the $2,700 to $2,800 region, a move toward the $3,100 to $3,200 zone could materialize, which would place Ethereum back above the psychologically critical $3,000 mark.
Risks Ahead: Support and Downside Scenarios
However, the path to recovery is not devoid of risks. Analysts caution about a potential downside if the current support level fails to hold. A breach could expose Ethereum to a deeper retracement, possibly targeting the $2,500 level. The interplay between bullish signs and potential bearish threats remains a delicate balance in the current market landscape.
With Ethereum’s price movements and market dynamics shifting rapidly, traders are left to navigate an environment marked by volatility and opportunity. The crucial next steps lie in observing how these metrics play out in real-time, and how traders respond to both the bullish signals and potential pitfalls that lie ahead.
