


The Current State of Ethereum: An In-Depth Elliott Wave Analysis
As Ethereum (ETH) continues to capture the attention of crypto enthusiasts, the application of the Elliott Wave (EW) Principle provides a structured approach to evaluate its price movements. In our previous discussions, we highlighted the critical resistance level at the 200-day Simple Moving Average (SMA) and the implications of price movements around this threshold. This article delves deeper into Ethereum’s current trajectory and offers insights on potential future movements.
Understanding the Elliott Wave Principle
The Elliott Wave Principle is a popular method used by traders to analyze market trends through predictable cycles of price movements. In the case of Ethereum, we’ve identified two possible paths based on recent price actions. According to our prior analysis, if the bulls failed to surpass the 200-day SMA and the price dropped below last week’s lows, it would suggest that the anticipated red W-i of the new bull run reaching $6100+ had already peaked. Conversely, if the bulls managed to break through, it would signify that a new wave cycle was beginning.
Recent Price Movements and Retracements
Fast forward three weeks since our previous update, Ethereum indeed struggled to maintain momentum above the 200-day SMA. On a recent Monday, the price did briefly break this resistance but stalled at approximately $2380. This action resulted in a retracement of around 23.8%—less than the typically expected range of 50-61.8% for a second wave (red W-ii). This shallower retracement introduces an interesting dynamic into the ongoing analysis.
The Start of Wave Red W-iii
Despite the retracement being less deep than anticipated, the occurrence of the red W-ii wave is still validated. As Ethereum breaks through the (Red) 200-day SMA, it indicates that the green W-1 wave of the red W-iii is underway. This new wave will subdivide into smaller phases, leading us into a more intricate wave structure. To clarify, the gray W-i of the green W-1 of the red W-iii is now starting to form, laying the groundwork for Ethereum’s bullish rally.
The Fibonacci-based targets for red W-iii are set as minimums, as we still anticipate the price could eventually reach $6100+. It’s essential to recognize that markets often do not adhere strictly to textbook retracement levels. Instead, the technical corrections serve to mitigate overbought conditions, which can be achieved through time or price adjustments.
Assessing Market Sentiment: The Alternative Path
Given the recent sideways price action, our alternative scenario suggests that the current rally from Friday’s low may represent the green W-5 of the red W-i wave. This viewpoint allows for adjustments in our expectations and strategies.
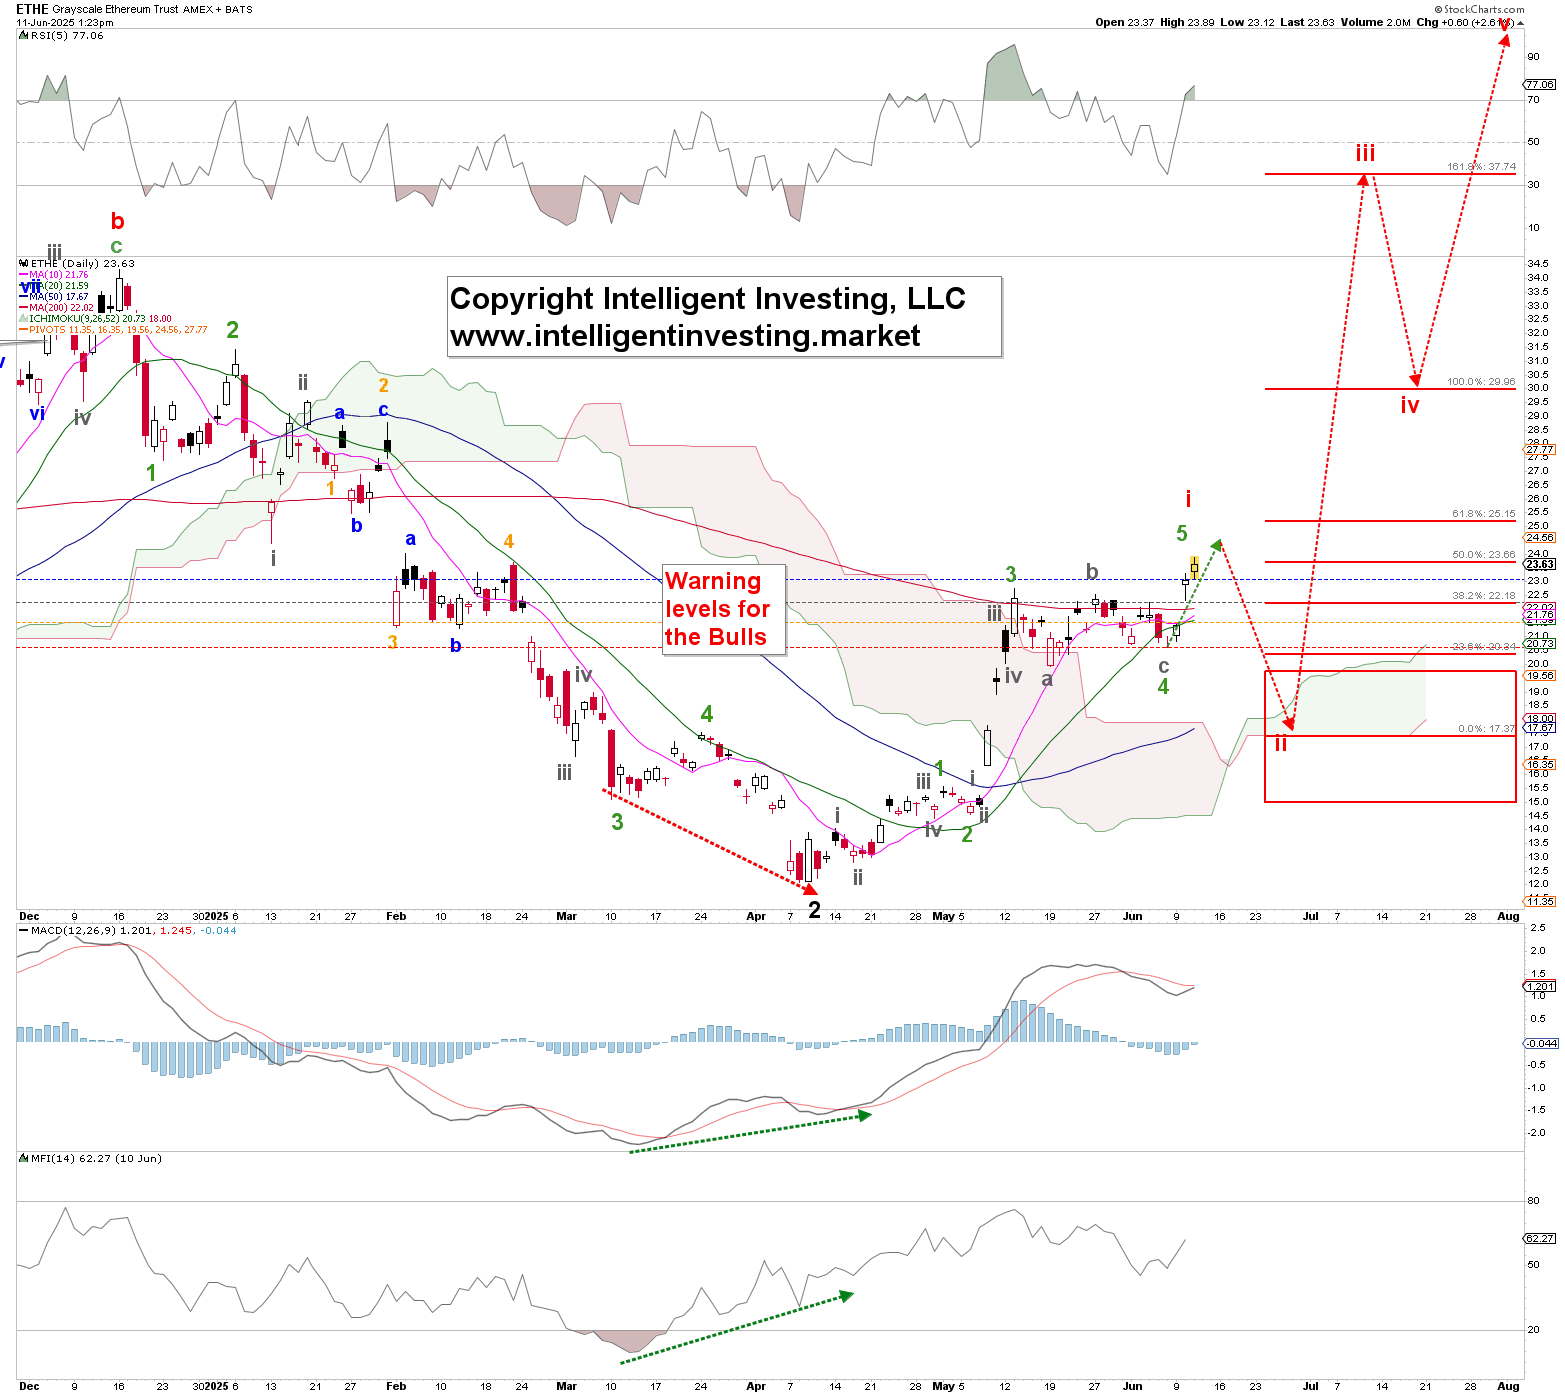
To illustrate this approach, we can refer to the Grayscale Ethereum Trust (ETHE) Exchange-Traded Fund (ETF). In this scenario, the red W-i is predicted to peak around $25 for ETHE, correlating with approximately $3,000 for ETH. Following this peak, we observe a potential red W-ii retracement, ideally settling around $2,250 for Ethereum and $17.50 for ETHE.
However, this scenario is contingent on the bears managing to push the price below last Friday’s low. Specifically, the key levels to watch are ETHE around $20.60 and ETH approximately at $2385. If these levels are breached, it will reinforce the validity of the alternative path.
Risk Management and Future Expectations
The Elliott Wave analysis offers a robust framework for risk management, especially with clearly identified stop levels taking shape. Regardless of which wave count materializes, both paths are designed to lead us toward the same goal: Ethereum embarking on its bullish journey toward approximately $5000+.
This multi-faceted approach to price analysis emphasizes the critical need to maintain a long-term perspective. As we navigate through daily fluctuations, it’s essential to remember that while short-term movements can be unpredictable, the overarching long-term trends provide a clearer pathway for potential gains.
By continuing to update insights and analyses in our premium newsletter, we aim to keep our readers well-informed and prepared for any market eventualities. Check back with us for further developments as we continue to explore Ethereum’s evolving narrative.
