


Analyzing Ethereum’s Current Market Situation
Ethereum, the second-largest cryptocurrency by market capitalization, is currently navigating a correction phase after it was unable to sustain momentum above the $4,200 mark. At present, ETH trades around $3,700, showing signs of weakness both technically and sentiment-wise. With buyers appearing to lose control, market participants are shifting their attention to the critical support zones below.
Technical Analysis
By Shayan
The Daily Chart
On the daily timeframe, Ethereum (ETH) has broken below a significant long-term ascending channel structure, along with the crucial 100-day moving average around $4,100. The price action is gravitating towards the 0.5 Fibonacci retracement level located at $3,530. This support zone is particularly essential as it previously acted as a springboard for the most recent rally in August.
The Relative Strength Index (RSI) hovers around 37, indicating bearish momentum, although it hasn’t yet reached oversold territory. This suggests that further downside may still be in the cards. A clean breakdown below the psychological threshold of $3,500 could pave the way towards the 0.618 Fibonacci retracement level, which sits at $3,200. Conversely, reclaiming the previous price high of $4,200 would signal a restoration of bullish momentum.
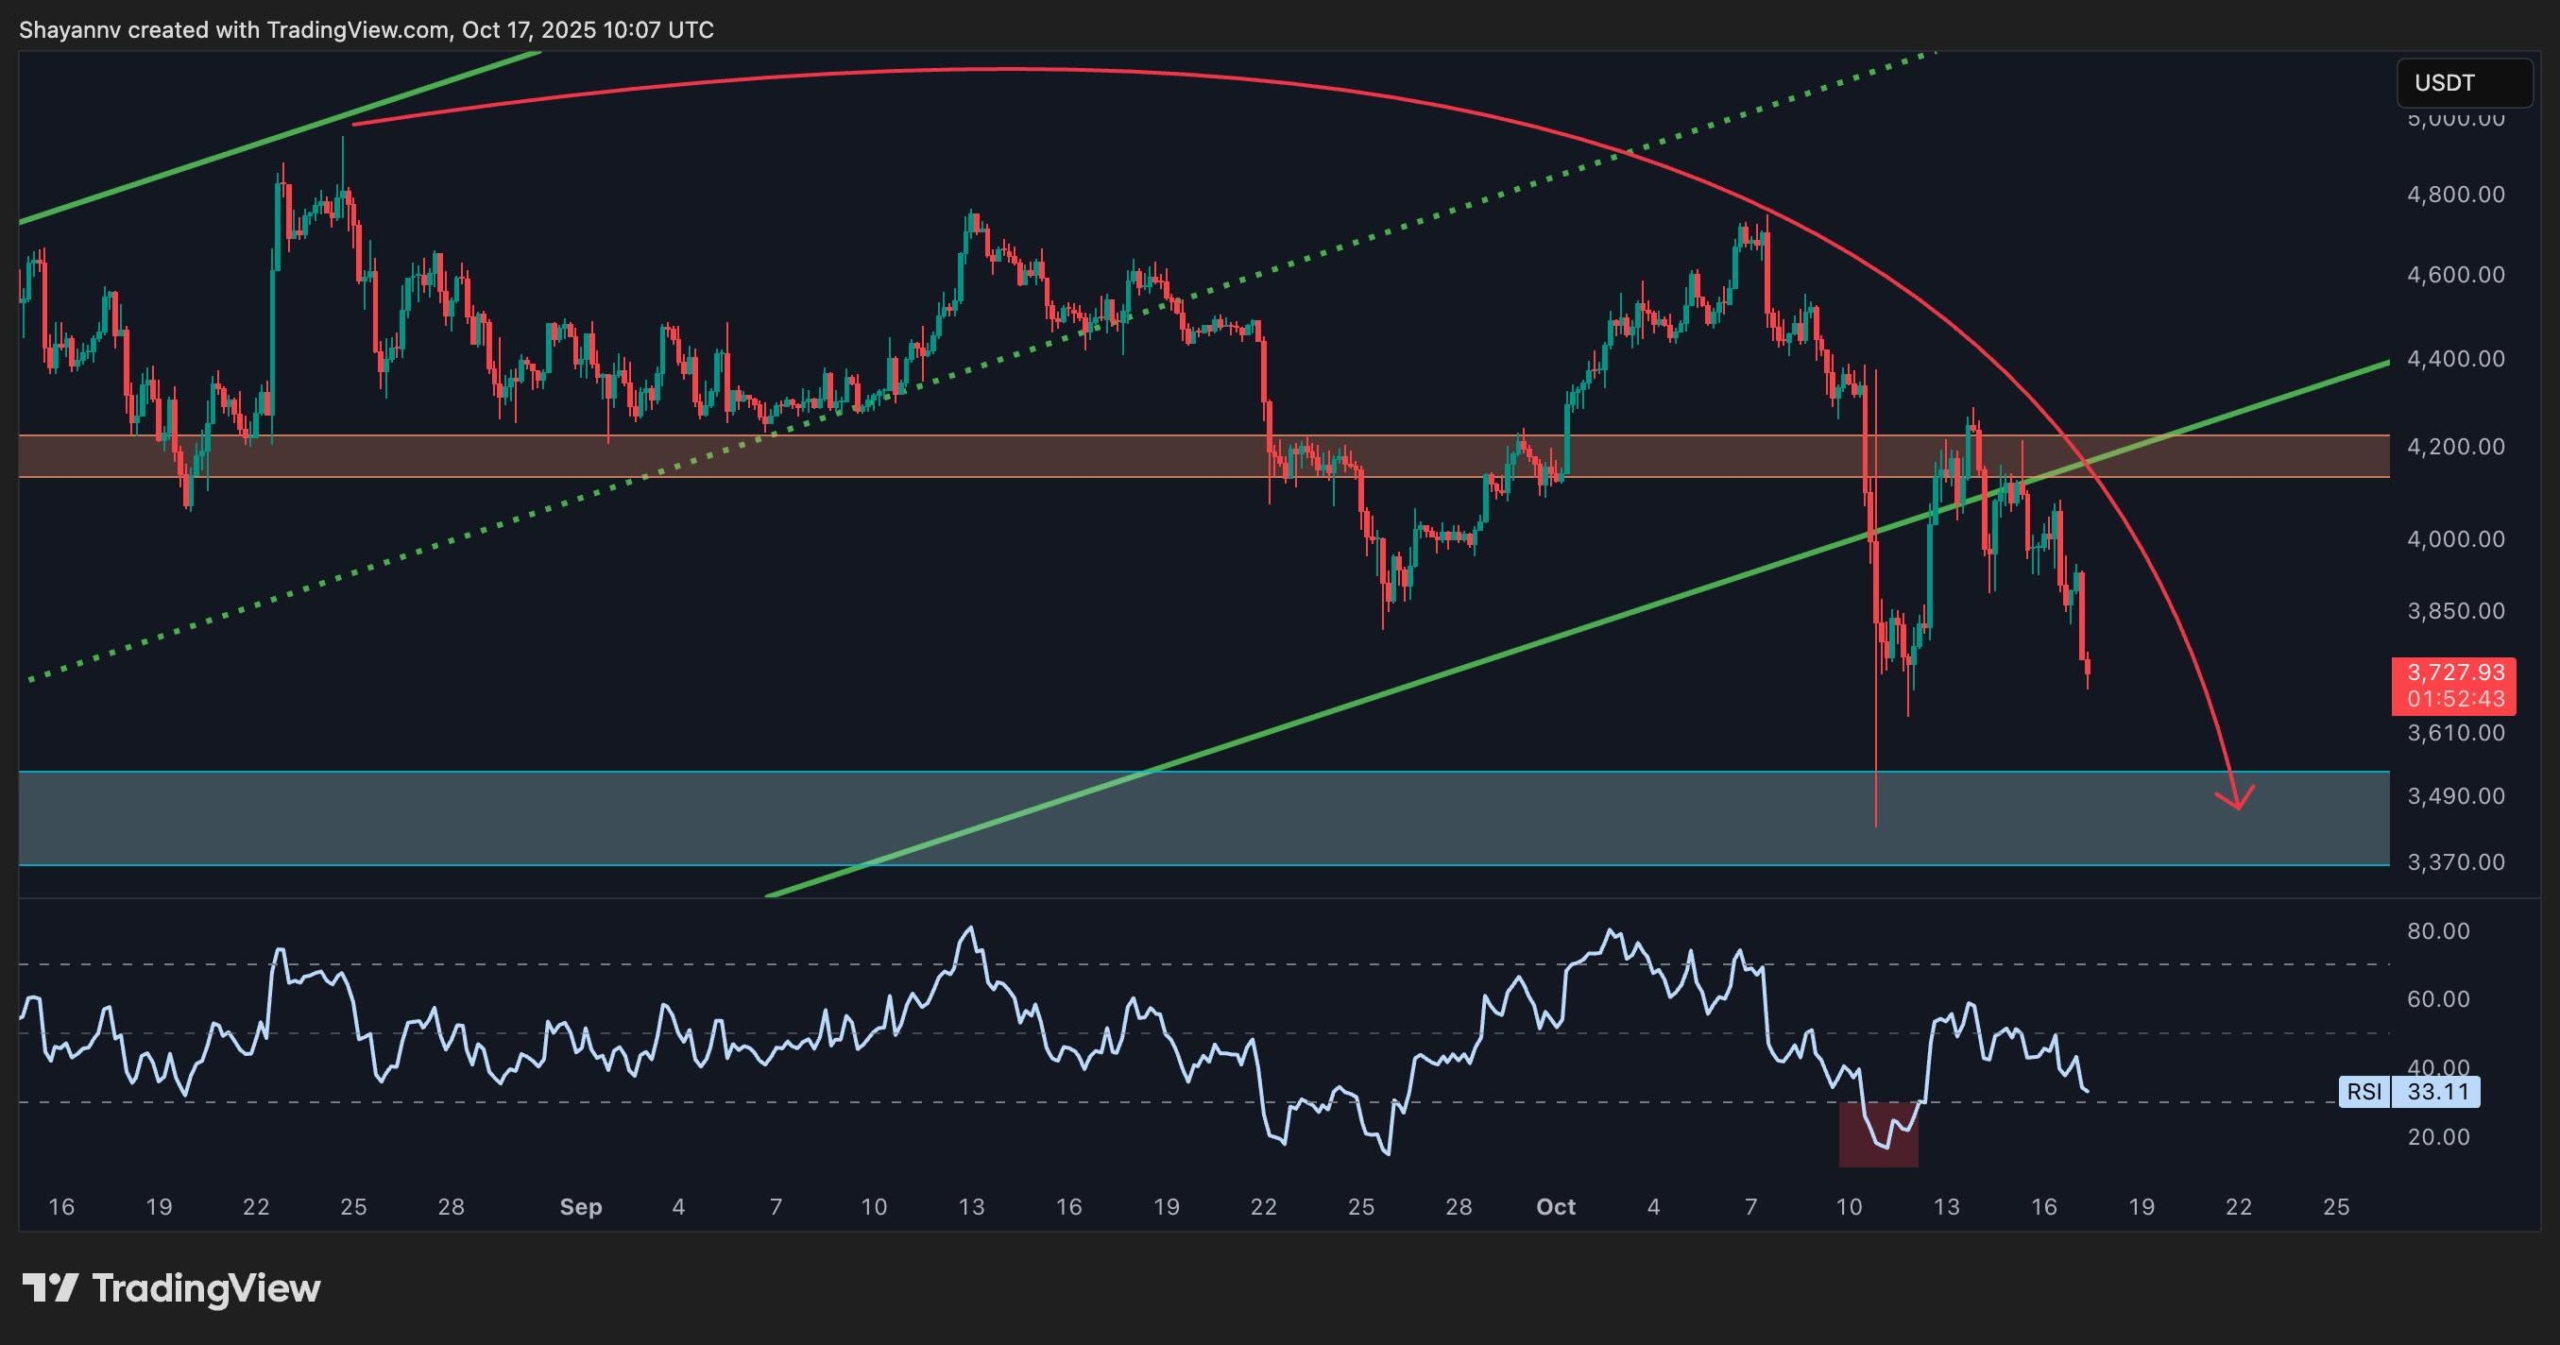
The 4-Hour Chart
The 4-hour chart reveals a clearer picture of the ongoing bearish order flow. Ever since losing the pivotal $4,200 level, Ethereum has struggled to regain footing, and the recent rejection from this area marks a definitive shift in market structure towards the bearish side.
Momentum indicators remain weak, with the RSI near 33, indicating that sellers are currently in control. The next demand zone is situated around $3,500 to $3,400, where buyers previously held their ground during a massive liquidation event. However, should this level fail to hold, we could see a swift move toward $3,200 or even $3,000, presenting a deeper decline.
Sentiment Analysis
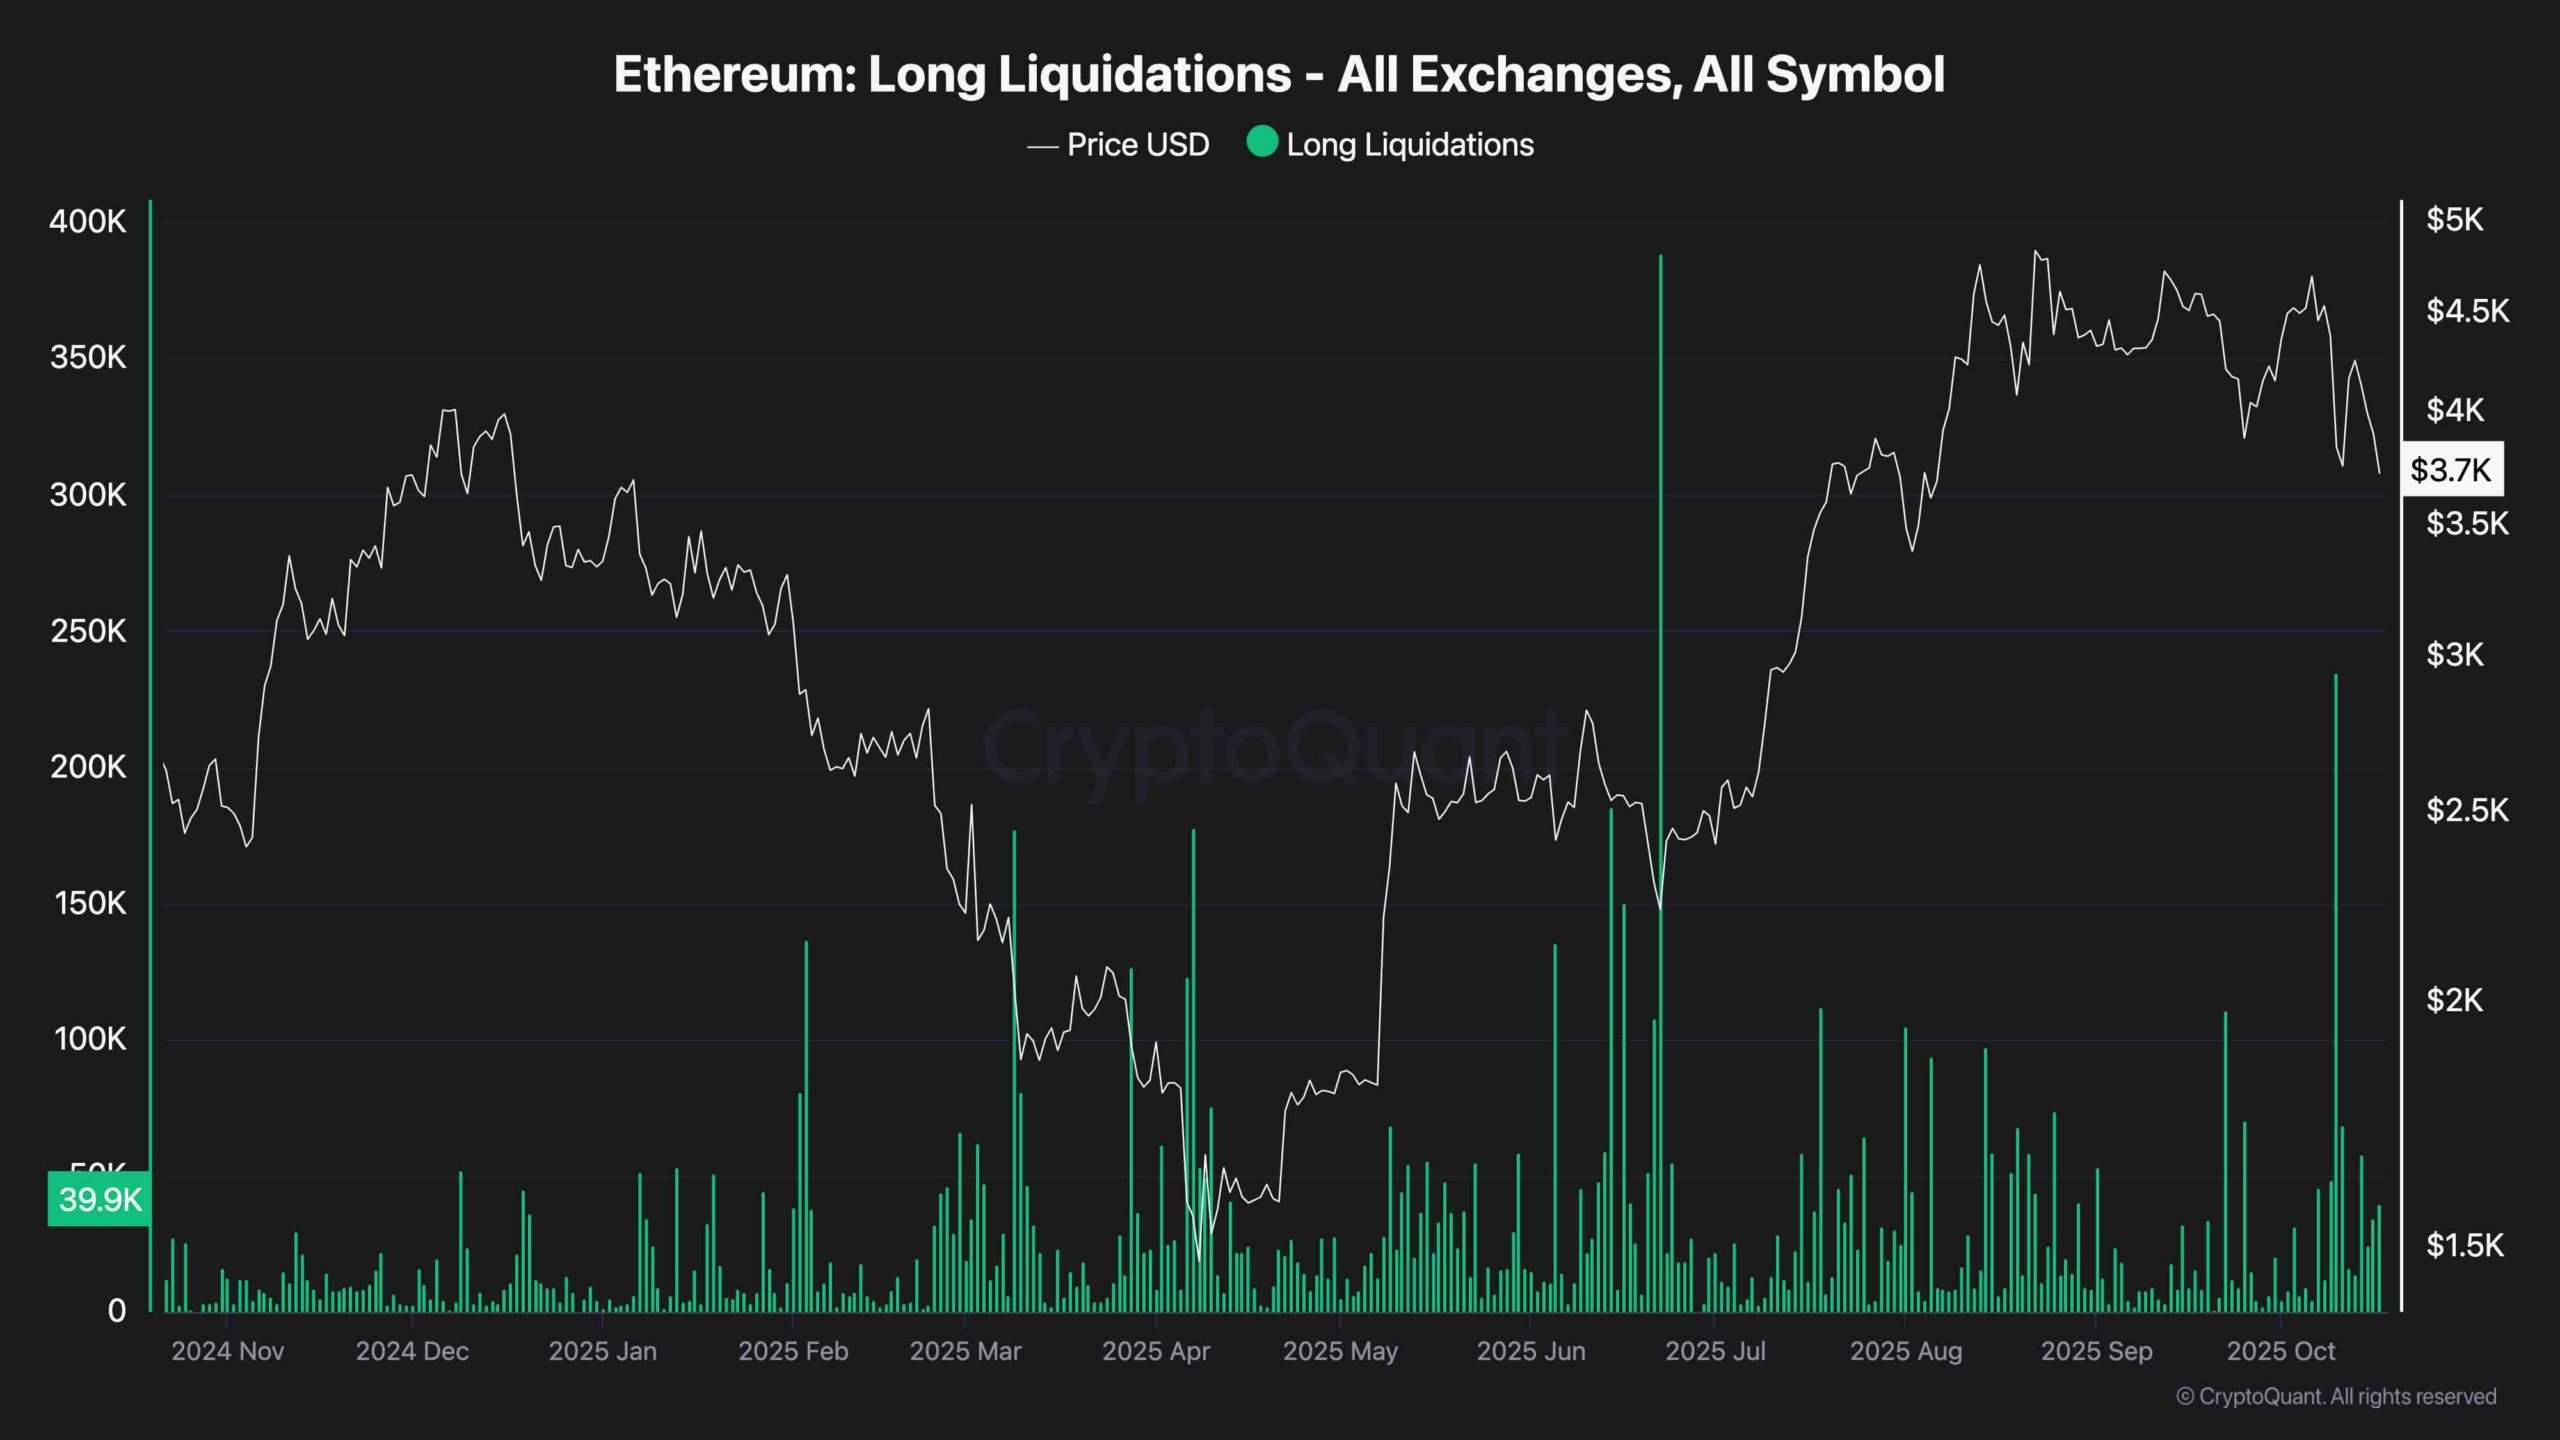
Long Liquidations
Ethereum’s recent drop has triggered a significant spike in long liquidations across all exchanges, characterizing one of the most substantial deleveraging events in recent months. This influx of forced selling highlights how overconfident long traders were unexpectedly caught off guard by the market’s abrupt reversal.
Historically, liquidation spikes like these often arrive near local bottoms, flushing out leveraged positions. However, the scale of this latest move indicates a sense of panic among retail traders, while institutions appear to be awaiting clearer signs before re-entering the market.
Current market sentiment remains fearful and risk-averse; traders are opting for caution rather than aggressively pursuing long positions in the near term.
Ethereum is currently at a pivotal juncture, and with the market’s volatile nature, it will be crucial to keep a close watch on these technical and sentiment indicators as the situation develops. Traders and investors must remain vigilant as they navigate through this uncertain landscape.
